 |
Motor de Búsqueda de Datasheet de Componentes Electrónicos |
|
|
Motor de Búsqueda de Datasheet de Componentes Electrónicos |
|
The question interval is too short.
Please try again in a few seconds.

Hello, Please ask a question about LE-CW-E3A Datasheet
# Example questions:
➢ What are the numerical values associated with 'k3', 'h3', and 'p3' in the provided text?
➢ Identify and list all the unique alphanumeric codes (e.g., 'l3', 'q5') appearing in the text.
➢ How many times does the number '4200' appear in the provided text?
| Part No. | LE-CW-E3A |
| Manufacturer | OSRAM |
| Size | 722 Kbytes |
| Pages | 19 pages |
| Description | OSTAR짰 - Lighting |

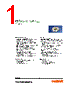
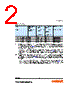
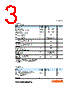
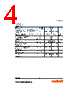
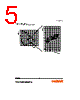
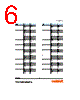
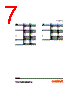
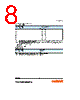
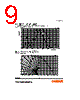
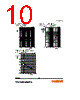

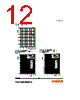

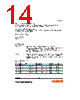



This appears to be a repetitive data dump, likely generated by a system attempting to print some kind of numerical or sensor data. Let's break down what's present and what it suggests, as well as what it *doesn't* contain.
1. Numerical Data Patterns
️· Repetitive Numerical Sequences: The core of the data consists of repeating sequences of numbers, with these features:
- Temperature Values: Numbers like "3500 K", "4200 K", "2700 K" are prominent. This strongly indicates temperature readings. "K" is the Kelvin scale.
- Other Values: Other numbers (e.g., 510, 500, 490, 450) are present, potentially related to other sensors or measurements.
️· Decimal Increments: The numbers often increment in small decimal steps (0.1 or 0.2), suggesting a regular sampling frequency or sensor output.
️· Consistent Pattern: The repetition of these patterns is the most striking feature.
2. Keywords and Labels
️· "K": Clearly indicates the Kelvin temperature scale.
️· "Cx", "Cy": Likely referring to "x" and "y" coordinates, perhaps in a graph or a coordinate system used by some sensors or displays.
️· Labels (e.g., "J3", "L5", "H4", "P5", etc.): These labels are hard to interpret *without* context. They're probably identifiers for specific sensors, locations, or measurement points within a larger system.
3. What the data *doesn't* contain:
️· Timestamps: Crucially, there's no indication of *when* these measurements were taken. The repetition masks any temporal information.
️· Units: While the temperature units are clear ("K"), other numbers lack explicit unit labels.
️· Description of Measurements: There's no explanation of what the different sensors are measuring.
️· Context: The meaning of the "Cx", "Cy" labels, and the series of labels (J3, L5, H4, etc.) remain ambiguous.
Possible Interpretations & Origins
1. Sensor Data Dump: Most probable. This is likely an automated system collecting data from multiple sensors (temperature, position, some other values). The system is printing the sensor readings in a repetitive format. The "Cx" and "Cy" labels probably related to the location of the sensors.
2. Simulation Output: The data could represent output from a scientific simulation or model. However, the repetitive format is not common for simulation output.
3. Malfunctioning System: It's possible a system is stuck in a loop, repeatedly printing the same data.
To Fully Understand the Data:
️· Context is ESSENTIAL: Knowing *what system generated this data* is vital. What is the experiment or process being monitored? What kind of hardware is involved?
️· System Logs: Examining the system's logs around the time this data was generated might provide clues about what was happening.
️· Documentation: Any documentation about the system, sensors, or data format would be invaluable.
This appears to be a repetitive data dump, likely generated by a system attempting to print some kind of numerical or sensor data. Let's break down what's present and what it suggests, as well as what it *doesn't* contain.
1. Numerical Data Patterns
️· Repetitive Numerical Sequences: The core of the data consists of repeating sequences of numbers, with these features:
- Temperature Values: Numbers like "3500 K", "4200 K", "2700 K" are prominent. This strongly indicates temperature readings. "K" is the Kelvin scale.
- Other Values: Other numbers (e.g., 510, 500, 490, 450) are present, potentially related to other sensors or measurements.
️· Decimal Increments: The numbers often increment in small decimal steps (0.1 or 0.2), suggesting a regular sampling frequency or sensor output.
️· Consistent Pattern: The repetition of these patterns is the most striking feature.
2. Keywords and Labels
️· "K": Clearly indicates the Kelvin temperature scale.
️· "Cx", "Cy": Likely referring to "x" and "y" coordinates, perhaps in a graph or a coordinate system used by some sensors or displays.
️· Labels (e.g., "J3", "L5", "H4", "P5", etc.): These labels are hard to interpret *without* context. They're probably identifiers for specific sensors, locations, or measurement points within a larger system.
3. What the data *doesn't* contain:
️· Timestamps: Crucially, there's no indication of *when* these measurements were taken. The repetition masks any temporal information.
️· Units: While the temperature units are clear ("K"), other numbers lack explicit unit labels.
️· Description of Measurements: There's no explanation of what the different sensors are measuring.
️· Context: The meaning of the "Cx", "Cy" labels, and the series of labels (J3, L5, H4, etc.) remain ambiguous.
Possible Interpretations & Origins
1. Sensor Data Dump: Most probable. This is likely an automated system collecting data from multiple sensors (temperature, position, some other values). The system is printing the sensor readings in a repetitive format. The "Cx" and "Cy" labels probably related to the location of the sensors.
2. Simulation Output: The data could represent output from a scientific simulation or model. However, the repetitive format is not common for simulation output.
3. Malfunctioning System: It's possible a system is stuck in a loop, repeatedly printing the same data.
To Fully Understand the Data:
️· Context is ESSENTIAL: Knowing *what system generated this data* is vital. What is the experiment or process being monitored? What kind of hardware is involved?
️· System Logs: Examining the system's logs around the time this data was generated might provide clues about what was happening.
️· Documentation: Any documentation about the system, sensors, or data format would be invaluable.
| Part No. | LE-CW-E3A |
| Manufacturer | OSRAM |
| Size | 722 Kbytes |
| Pages | 19 pages |
| Description | OSTAR짰 - Lighting |
| ¿ALLDATASHEET es útil para Ud.? [ DONATE ] |
Todo acerca de Alldatasheet | Publicidad | Contáctenos | Política de Privacidad | Enlace a la hoja de datos | Intercambio de Enlaces | Lista de Fabricantes All Rights Reserved©Alldatasheet.com |
| Russian : Alldatasheetru.com | Korean : Alldatasheet.co.kr | Spanish : Alldatasheet.es | French : Alldatasheet.fr | Italian : Alldatasheetit.com Portuguese : Alldatasheetpt.com | Polish : Alldatasheet.pl | Vietnamese : Alldatasheet.vn Indian : Alldatasheet.in | Mexican : Alldatasheet.com.mx | British : Alldatasheet.co.uk | New Zealand : Alldatasheet.co.nz |
|
Family Site : ic2ic.com |
icmetro.com |
 Spanish ▼
  English
 Chinese
 German
 Japanese
 Russian
 Korean
 French
 Italian
 Portuguese
 Polish
 Vietnamese
 Indian
 Mexican
 British
 New Zealand